

 Evan Diaz de Arce


8 financial model best practices for startup founders
A great financial model is critical for every startup. It allows you to get a glimpse of your future financial data. It allows you to make better...
A solid financial model is a necessity for any founder who wants to raise funds or optimize their business operations. A well-crafted model helps you make better decisions, impress investors, and see a glimpse of your financial future.
Today’s best financial models are built using fully-featured software like Forecastr that allows you to build complex models, what-if scenarios, and complicated revenue streams.
However, many founders aren’t ready to adopt a dedicated financial modeling software yet, for one reason or another. If that’s you, then you’re probably planning to build your model in Excel, Google Sheets, or another spreadsheet application.
Building a financial model in Excel can be a challenge, especially if you don’t have a lot of experience with complex spreadsheets. But don’t worry, we’ve got you covered with some great templates and several tips to help you build a useful model that will give you a lot of good insight into your business.
Financial modeling in Excel is the process of creating a structured representation of a company's financial performance, using spreadsheets to forecast future earnings, expenses, and other metrics. Excel's powerful functions and features make it an ideal tool for building and analyzing financial models, helping businesses make informed decisions and plan for the future.

We help a lot of founders build great financial models. In the process, we see a lot of common mistakes. Some of these mistakes just make the model hard to read, but others can cause inaccuracies in your data that could potentially impact your decision-making or fundraising.
The tips we’re sharing below will help you steer clear of those common mistakes and create a reliable Excel model that’s easy for anyone to read and understand.
To make things even easier, we also have some free spreadsheet templates you can use as a starting point. If you start with one of our templates and follow the tips below, you should be in a good position to start using your model right away.

Before you dive in and start importing your data into one of our templates, take a few minutes to read through these best practices, as well as the best practices for adding data to your model, below. These will keep you on the right track and keep any re-work to a minimum.

You need your financial model to reflect your business model as closely as possible. Spend a little time thinking about your operation and make sure that all of the important pieces are included.
Ask yourself these questions:
Knowing the answers to these questions will make it much easier to build a financial model that accurately reflects your business.
You can turn yourself inside out thinking about all the different behaviors your customers could exhibit (refunds, introductory discounts, churned customers returning in the future, etc.). These things may be important to your business, but they don’t necessarily need to be shown in your financial model.
It’s extremely challenging to accurately model complex customer behaviors. You’ll create a better model that’s easier to maintain and use if you avoid diving too deep into the details.
If you do need to create customizations for any unique requirements, this might come in helpful: Excel Formulas for Financial Modeling.
100% of financial models are wrong. That’s why they’re called models.
However, with consistent use and frequent updates, you can create a financial model that’s an accurate and reliable representation of your business. Analyze your forecast against your actual financial performance every month, and you’ll dial your model in and increase its accuracy over time. More on this below.
How should you structure the various elements of your Excel financial model? What’s the best layout to use? How should you format your data? Here's how to do financial modeling in Excel:
The best approach is to keep your structure clean and simple. This will make it easier and less time-consuming to use and update each month.
At Forecastr, we like to break our spreadsheet revenue models down into 3 or 4 tabs (or sheets).
Your cover page should include your name and logo, along with a link to your website and your direct contact information.
Including a table of contents with links to the corresponding sections makes your model user-friendly for other people. Use the remaining space to provide a brief overview of what’s included in the model and how it works.
This might seem unnecessary, but it adds a lot of value when you share the model with investors and other stakeholders who haven’t seen it before.

Use the second tab to host all of the assumptions that will drive the calculations in your revenue model.
In our templates, the top four rows are used for date counters. This allows you to create formulas based on dates. We typically include projections for 5 years or 60 months.
It’s useful to separate your assumptions into several sections. The right section designations might be different depending on your business model, but these sections will fit most use cases:
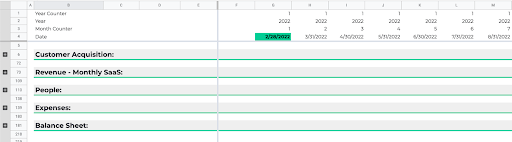
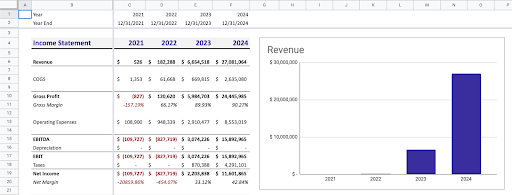
The monthly summary showcases your three financial statements every month.
Without getting into too much detail, the Income Statement should follow a standard flow and include the following:
The Balance Sheet keeps track of the balance of your assets, liabilities, and equity at any point during the forecast period.
The balance of assets must equal the balance of the sum of liabilities and equity. Our templates include a formula to indicate whether or not the balance is correct for each period.
The Cash Flow Statement keeps track of the cash in your business. Start with your beginning cash, then factor in financing, investing, and operating activities. These are your change in cash. Add (or subtract) your change in cash to your beginning cash to arrive at your ending cash.
The Cash Flow Statement tells you your burn rate, your runway, whether or not you’re operating at a loss, and how much money you might need to raise. As you can see, it’s very important.

This tab is optional, but it’s often useful to see a visual summary of your forecast. This is especially helpful for investors and stakeholders who want a snapshot of your projections without digging into the details.
You can use this tab to add any other graphs or visuals that would help an investor interpret your data or support the narrative you’re telling them in your pitch.
Now that you understand the basic structure of an Excel financial model, you’re ready to start inputting data to build the model. If you have good accounting data to work with, this part will be pretty straightforward.
Here are three best practices to help keep you on track while you populate your model:
Customer acquisition drives the entire model. Consider all of the strategies that you are using to acquire new customers, and include any strategies that you plan to add during the forecast period.
Some common examples of customer acquisition channels include outbound sales, paid ads, content marketing, influencer marketing, partnerships, etc.
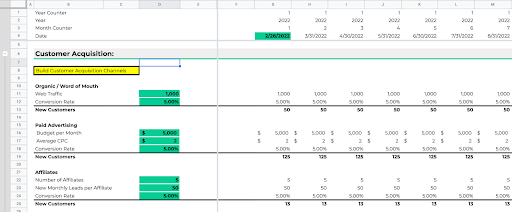
What is your cost per click? What is your conversion rate on those clicks? Base your model on the data you have available today, and avoid making up numbers to fill in the blanks. If the real number is zero, enter a zero in the model.
As you run your business and gather real data, come back and update your model. This shouldn’t be something that you build, use once, and never use again.
Each month, compare your forecast for key figures like customers, revenue, expenses, and payroll and compare it against your actual performance. If your forecast was way off, update your assumptions.
This is the way you refine your financial model over time to achieve an accurate forecast that’s representative of your business. Besides being a great tool for fundraising, the ultimate goal of a financial model should be to use it as a tool to help you make better business decisions.
To do this, you need your model to be based on your real data.
Here’s an example of a top-down assumption: “There are 8 billion people in the world; we can get 10% of them.”
Investors will immediately recognize assumptions like this as a red flag and you should too. Top-down assumptions can lead you astray in your decision-making and planning. It’s best to avoid them.
Here’s an example of a bottom-up model assumption: “If we make ten sales calls a month, we can convert 20% of those leads into customers. That means we get two customers a month. In the third year, we’ll have a larger team and we will make one hundred sales calls a month and get twenty customers.”
It’s OK to start your data analysis with small numbers. Investors would much rather see your real data with realistic growth assumptions. This approach will also give you a better understanding of your operation so you can make better decisions.

Optimal performance for your startup depends on having a reliable financial model that gives you insight and confidence as a founder.
A solid model is also key during the fundraising process. A well-built and detailed model shows investors that you have a strong command of your business and are capable of making the best decisions.
Building a financial model in Excel can be challenging, even for an experienced entrepreneur. Our spreadsheet templates will help. They’re a great resource and we encourage you to use them.
When you’re ready to upgrade to an online financial modeling solution, we’ll be here for you. Forecastr gives you a simple and convenient interface with great features and analysis that make your model easy to share and present.
When you sign up with Forecastr, a pair of experienced financial analysts work with you to build and maintain an amazing financial model with accurate data. You get ongoing support as needed, and we check in to help update your model every quarter. Reach out today to learn more and schedule a demo.

Subscribe on YouTube to get notified when we post new content
Get notified about new events, free resources, and fresh content

A great financial model is critical for every startup. It allows you to get a glimpse of your future financial data. It allows you to make better...

Inflation. It’s a big deal in the world of finance, and it affects all types of businesses, from huge enterprises to budding startups. If you’re on...

In our experience helping founders build great financial models, we’ve worked with startups that focus on SaaS, ecommerce, import/export,...